 |
Urlaubsplan
|
Lade ...
Suche ...
Keine Treffer
|
Urlaubsplan
|
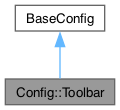
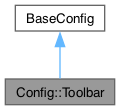
Öffentliche Attribute | |
| array | $collectors |
| bool | $collectVarData = true |
| int | $maxHistory = 20 |
| string | $viewsPath = SYSTEMPATH . 'Debug/Toolbar/Views/' |
| int | $maxQueries = 100 |
| array | $watchedDirectories |
| array | $watchedExtensions |
The Debug Toolbar provides a way to see information about the performance and state of your application during that page display. By default it will NOT be displayed under production environments, and will only display if CI_DEBUG is true, since if it's not, there's not much to display anyway.
| array Config::Toolbar::$collectors |
| bool Config::Toolbar::$collectVarData = true |
| int Config::Toolbar::$maxHistory = 20 |
| int Config::Toolbar::$maxQueries = 100 |
If the Database Collector is enabled, it will log every query that the the system generates so they can be displayed on the toolbar's timeline and in the query log. This can lead to memory issues in some instances with hundreds of queries.
$maxQueries defines the maximum amount of queries that will be stored.
| string Config::Toolbar::$viewsPath = SYSTEMPATH . 'Debug/Toolbar/Views/' |
| array Config::Toolbar::$watchedDirectories |
| array Config::Toolbar::$watchedExtensions |
 1.12.0